FREE TEMPLATE
Free Fishbone Diagram Template (Ishikawa Cause-and-Effect)
A free, interactive fishbone (Ishikawa) diagram template with a worked example. Map causes across six categories, then vote on the likely root cause as a team.
- Free, no sign-up
- Use ChatGPT, Claude or your own AI
- Up to 10 people
Try the example
Interactive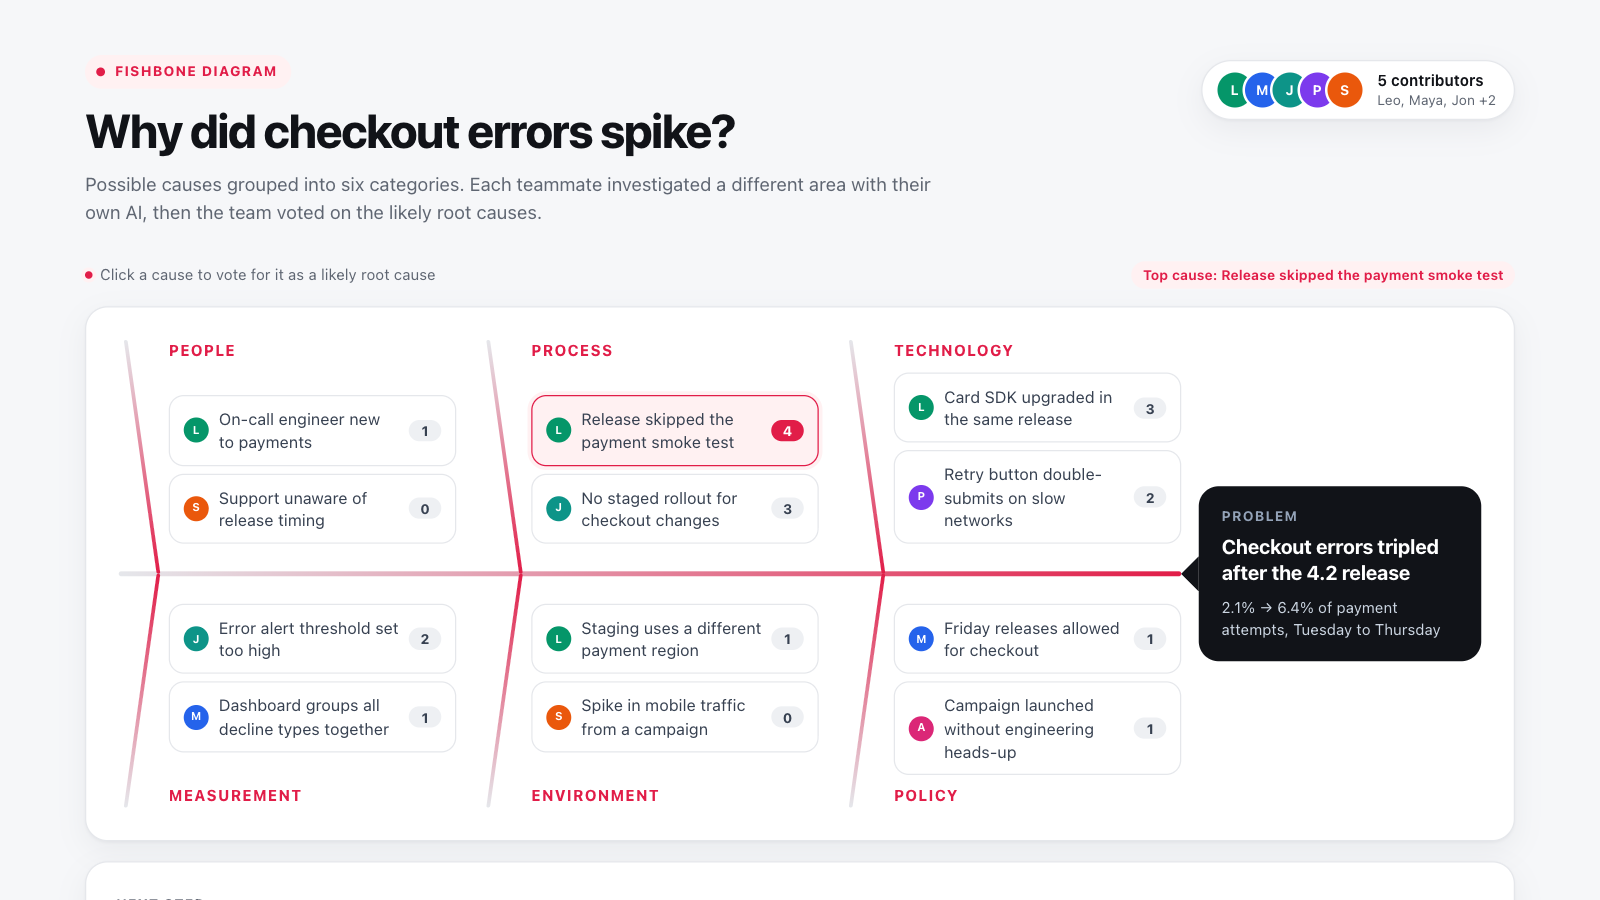
How to use this template in Boardblend
Open it as a live board
One click opens a ready-made board with every section laid out and empty. No account needed.
Connect your AI
Each person connects their own assistant to research and draft privately.
Decide together
Invite up to 10 people, agree the final version, then export it as a PDF or PNG.
Developed by Kaoru Ishikawa in the 1960s, a fishbone diagram helps a team look at every plausible cause of a problem before jumping to a fix. Named for its shape—and also known as an Ishikawa or cause-and-effect diagram—it puts the problem at the head and groups possible causes along the bones.
The example above investigates a spike in checkout errors after a release. It is interactive: click any cause to add your vote and see the leading root-cause candidates highlight.
How to structure a fishbone diagram
- Write the problem at the head. State the effect precisely, with a measurement: "Checkout errors tripled after the 4.2 release (2.1% → 6.4%)", not "checkout is broken".
- Choose the categories. This template uses six that suit software and service teams:
| Category | What to look for | Example cause |
|---|---|---|
| People | Skills, staffing, handovers | On-call engineer new to payments |
| Process | Steps skipped or missing | Release skipped the payment smoke test |
| Technology | Code, tools, dependencies | Card SDK upgraded in the same release |
| Measurement | Alerts, metrics, data quality | Error alert threshold set too high |
| Environment | Infrastructure, traffic, context | Staging uses a different payment region |
| Policy | Rules and norms | Friday releases allowed for checkout |
Manufacturing teams often use the traditional 6 Ms instead: Manpower, Methods, Machines, Materials, Measurement and Mother Nature.
- Add causes to each bone. Aim for two to five per category. Write each as a specific, checkable statement.
- Vote on likely causes. Each person votes for the causes they think contributed most. Votes show where to investigate first—not what is proven.
- Verify. Test the top causes with data before acting on them.
Fishbone diagram examples by industry
| Industry | Problem at the head | Typical categories |
|---|---|---|
| Manufacturing | Bottle caps leaking on line 3 | The 6 Ms: Manpower, Methods, Machines, Materials, Measurement, Mother Nature |
| Healthcare | Patient falls on a ward | People, Procedures, Equipment, Environment, Communication, Policy |
| Customer service | Satisfaction score dropped 12 points | The 4 Ss: Surroundings, Suppliers, Systems, Skills |
| Software | Checkout errors after a release | People, Process, Technology, Measurement, Environment, Policy |
Download your fishbone diagram
Fill in the board with your team, then use Export PDF or Export PNG to download a copy to share, print or attach to a document. A PNG drops straight into a Word report or PowerPoint slide, without redrawing the diagram by hand.
How to run a fishbone session with your team
Divide the categories so each person investigates one or two areas before the session—logs and release notes for technology, the runbook for process, dashboards for measurement. In Boardblend each teammate can use their own AI to search and summarize that evidence privately, then add causes to the shared diagram.
In the session, read the diagram together, merge duplicates, then vote. Discuss the causes with the most votes and any cause where one person has strong evidence but few votes—a single expert can be right while the majority is wrong. Collecting views independently first is one of the simplest guards against groupthink.
From fishbone to root cause
A fishbone diagram tells you where to look. To reach the underlying root cause, take each top-voted cause and ask "why?" until you reach something you can change. The 5 whys template is designed for exactly that step.
When the investigation is complete, record what you learned and the changes you'll make in a lessons learned review.
Common mistakes
- A vague problem statement. "Quality issues" produces vague causes.
- Stopping at symptoms. "Errors increased" is the effect, not a cause.
- Treating votes as proof. Votes prioritize investigation; evidence confirms causes.
- Blaming people. Put "on-call engineer new to payments" under People as a system gap (training, handover), not as fault.
COMMON QUESTIONS
Frequently asked questions
What is a fishbone diagram?
A fishbone diagram, also called an Ishikawa or cause-and-effect diagram, is a visual tool for finding the possible causes of a problem. The problem sits at the head of the fish, and causes are grouped into categories along the bones.
What are the 6 categories of a fishbone diagram?
Classic manufacturing versions use the 6 Ms—Manpower, Methods, Machines, Materials, Measurement and Mother Nature (environment). Software and service teams often adapt them to People, Process, Technology, Measurement, Environment and Policy, as in this template.
How do you identify the root cause from a fishbone diagram?
After listing causes, the team votes or uses evidence to identify the most likely ones, then tests them. For each likely cause, asking "why?" repeatedly—the 5 whys technique—helps reach the underlying root cause.
What are the 8 Ps and 4 Ss of a fishbone diagram?
They are alternative category sets. Marketing teams often use the 8 Ps (Product, Price, Place, Promotion, People, Process, Physical evidence, Productivity); service teams often use the 4 Ss (Surroundings, Suppliers, Systems, Skills).
When should you use a fishbone diagram?
Use it when a problem has many possible causes and the team needs to explore them broadly before narrowing down—for example a quality defect, an incident, a drop in a metric or recurring customer complaints.
Fishbone diagram vs 5 whys, which is better?
They work best together. The fishbone diagram explores causes broadly across categories; the 5 whys follows a single cause deeply. Start broad with the fishbone, then use the 5 whys on the top-voted causes.
RUN IT WITH YOUR TEAM
Start your fishbone diagram in one click.
Everyone brings their own AI, adds their thinking, and you agree the result together on one live canvas.
More free templates
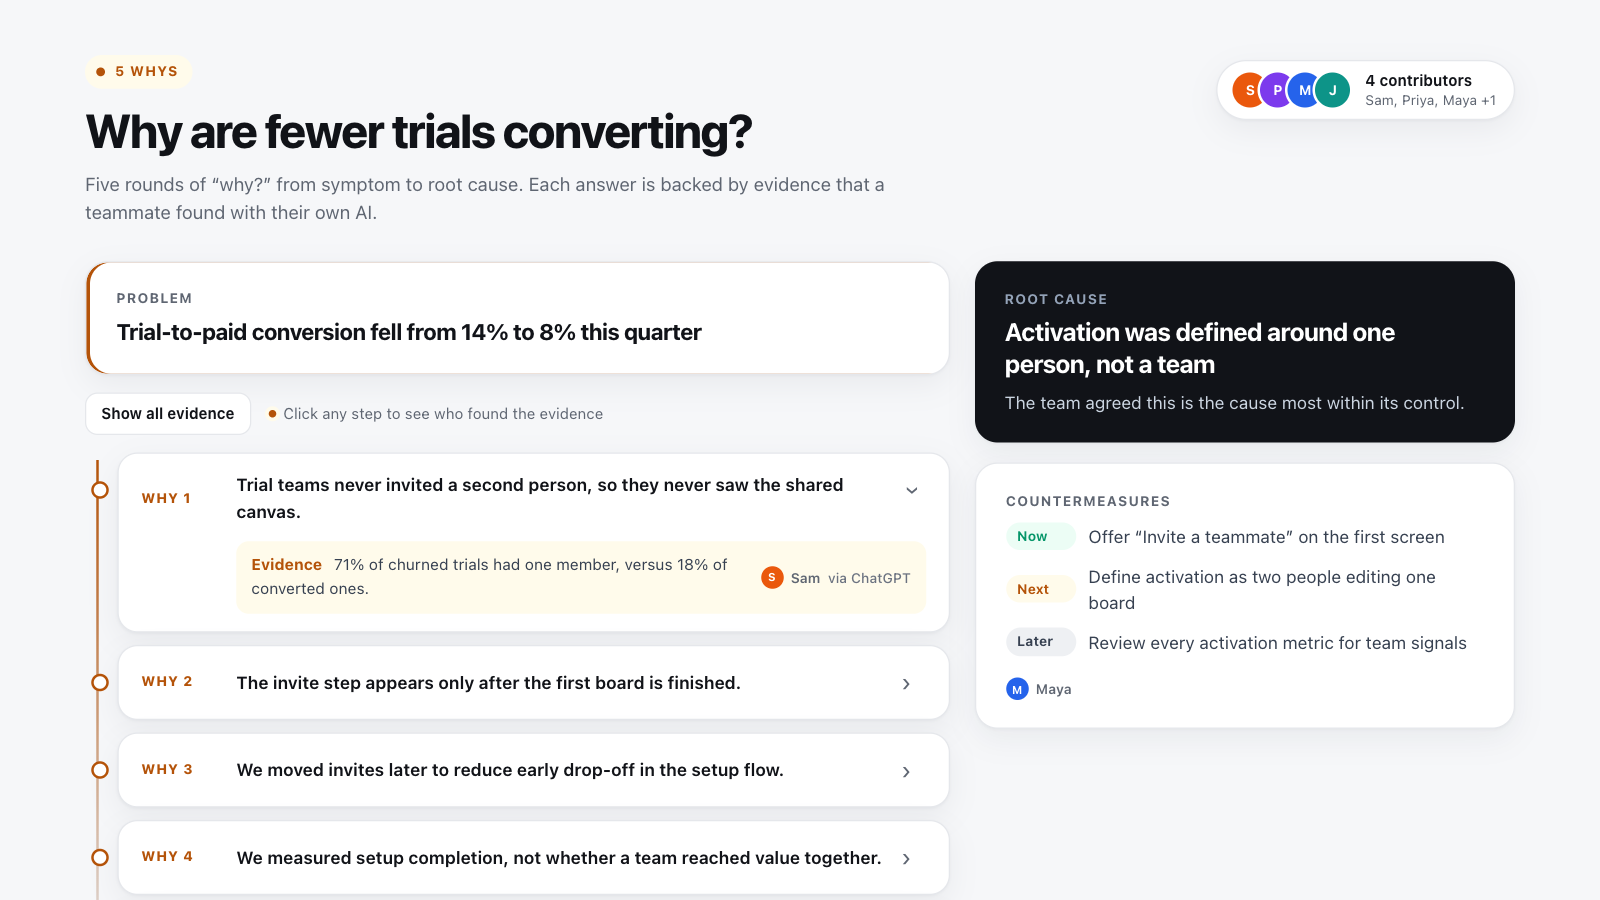
5 whys template
Ask “why?” five times, back each answer with evidence, and agree on countermeasures.
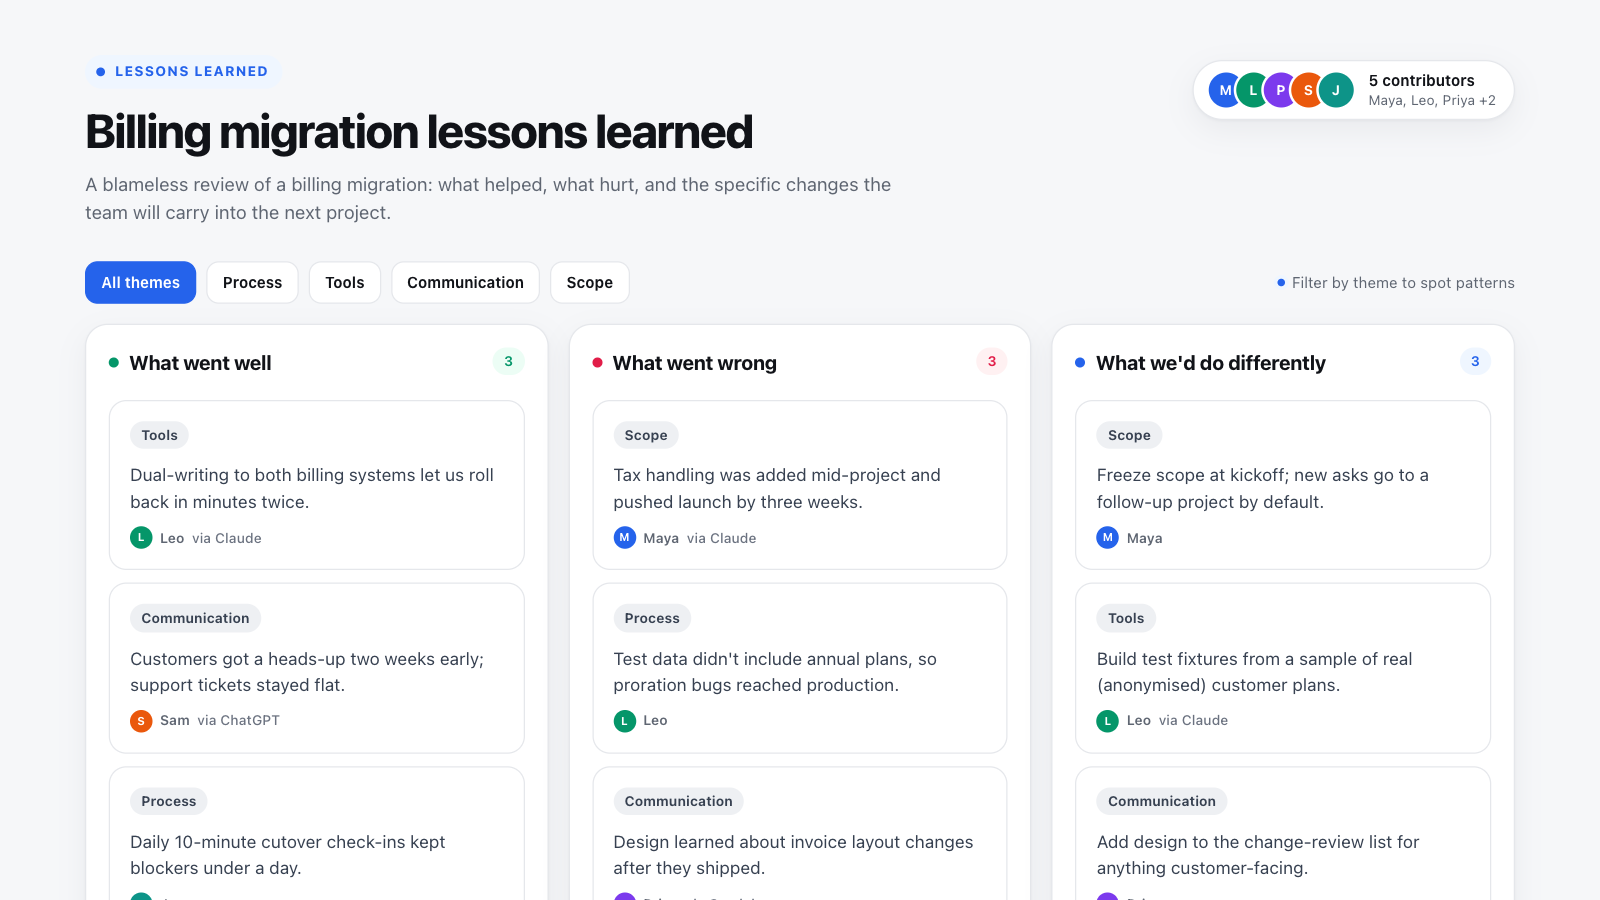
Lessons learned template
Capture what went well, what went wrong and what to change, with owners for every action.
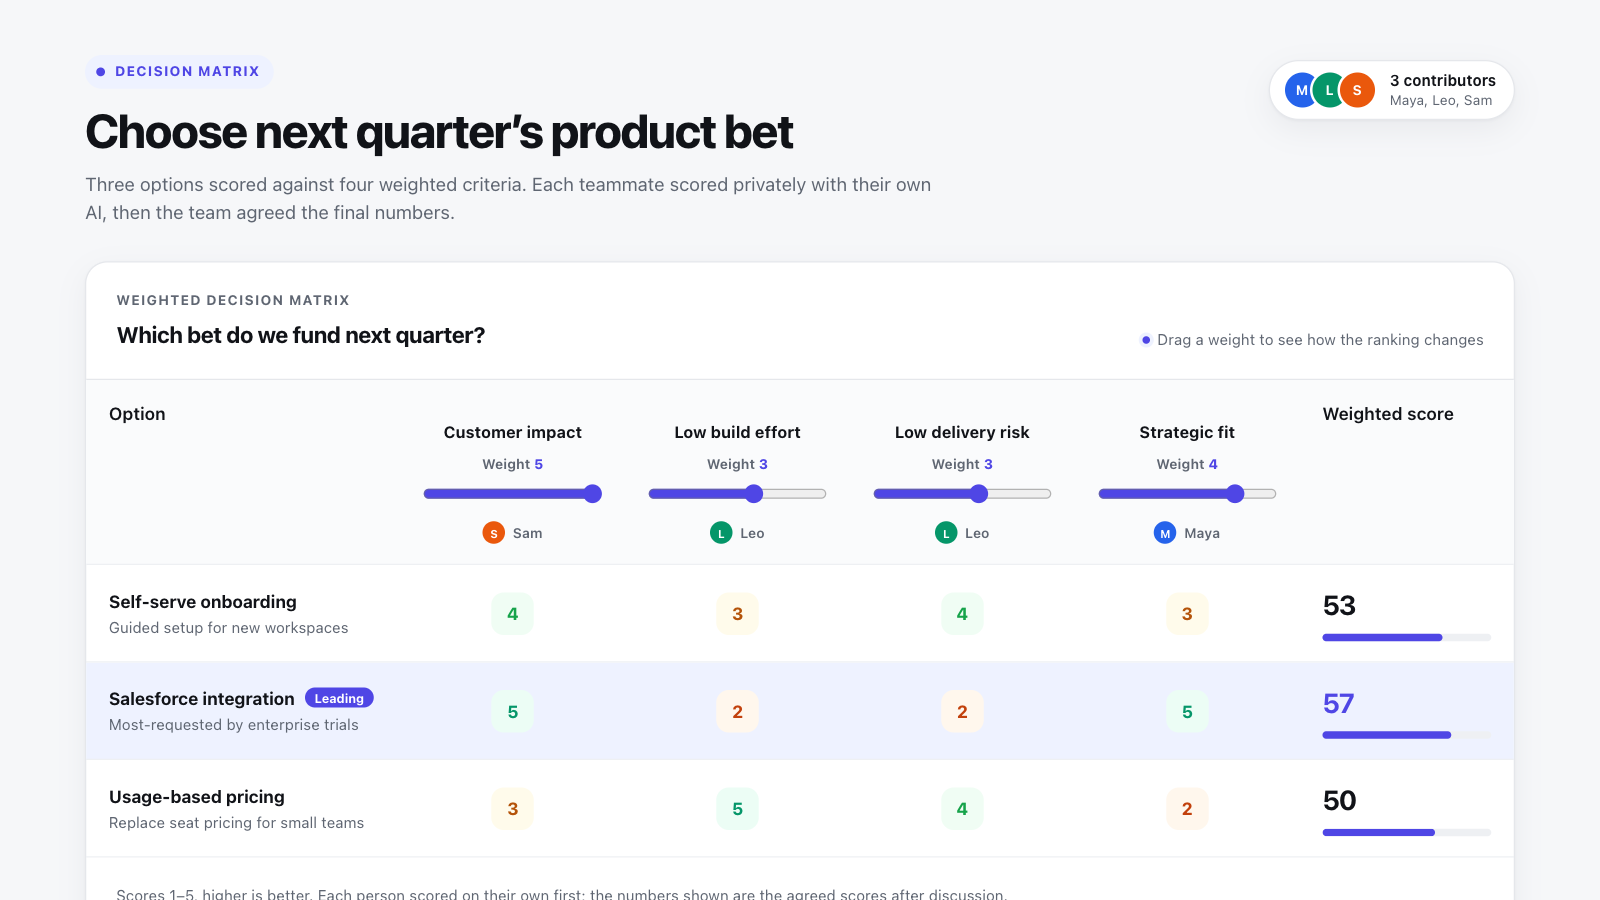
Decision matrix template
Score options against weighted criteria and see live which one wins, and how close it is.