FREE TEMPLATE
Free RICE Prioritization Template (With Calculator)
A free RICE prioritization template with a live calculator and worked example. Score features by reach, impact, confidence and effort, and see how the order changes.
- Free, no sign-up
- Use ChatGPT, Claude or your own AI
- Up to 10 people
Try the example
Interactive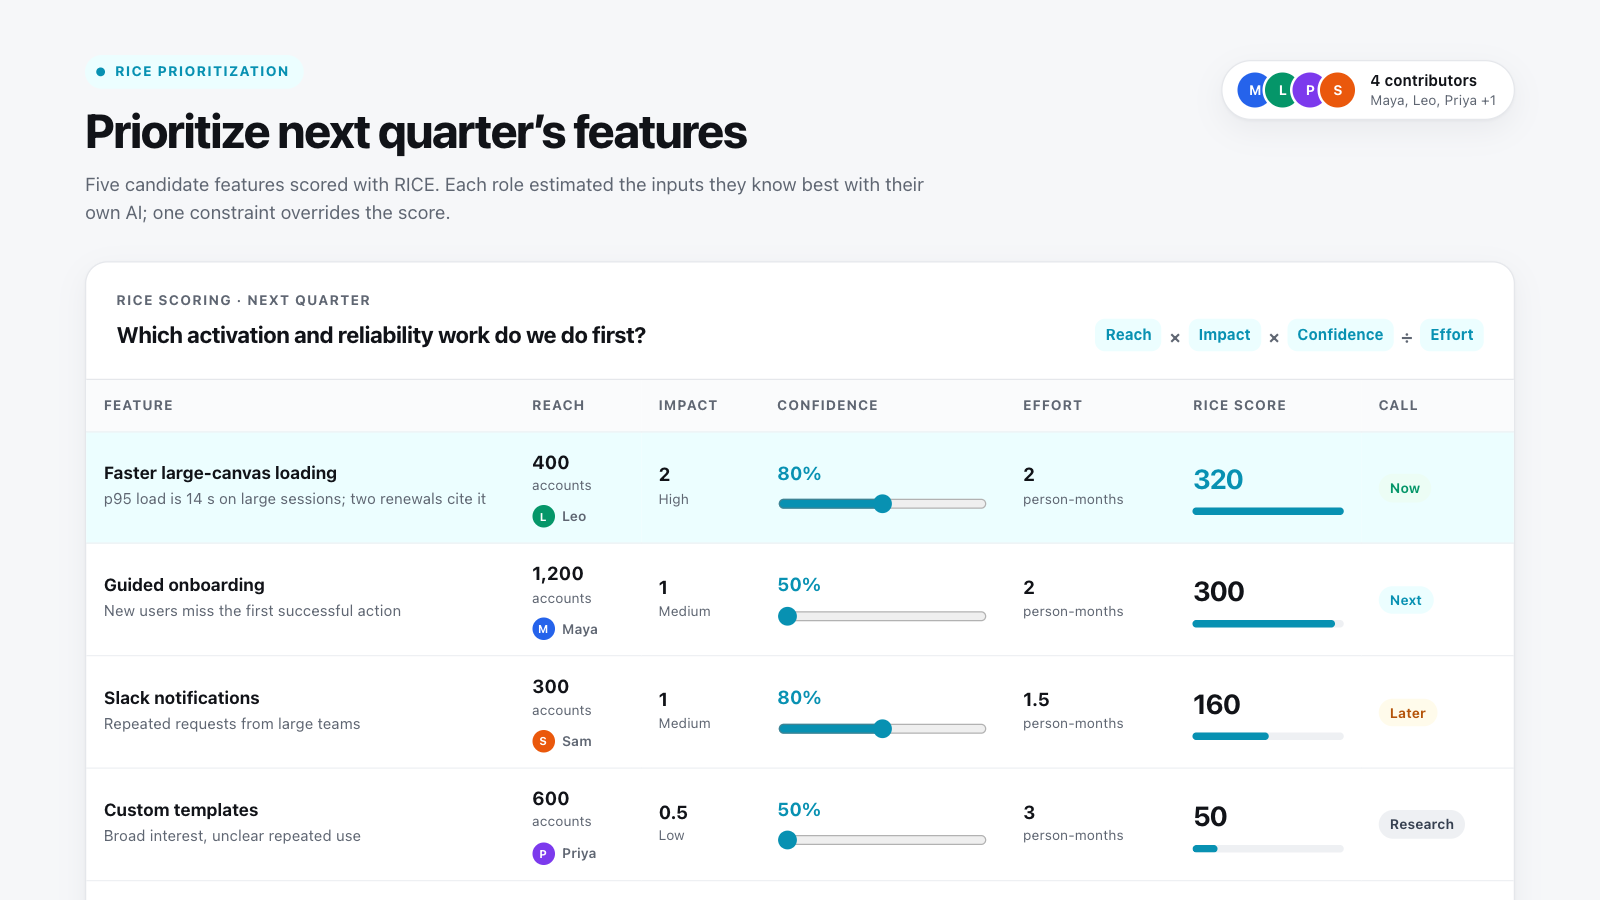
How to use this template in Boardblend
Open it as a live board
One click opens a ready-made board with every section laid out and empty. No account needed.
Connect your AI
Each person connects their own assistant to research and draft privately.
Decide together
Invite up to 10 people, agree the final version, then export it as a PDF or PNG.
RICE prioritization scores each feature as Reach × Impact × Confidence ÷ Effort, so work with very different benefits can be compared on one scale. This template is a live RICE calculator on a shared board, with each input owned by the person who knows it best.
The example above scores five features for next quarter. Drag a confidence slider to see the scores and the now, next and later calls change. Raise guided onboarding to 80% and it overtakes canvas performance, which is why the team chose a small experiment to earn that confidence.
The RICE example, section by section
| Section | What the example shows |
|---|---|
| RICE table | Five features with reach, impact, confidence, effort and a live score |
| Overrides | Export controls scores low but is set aside because it depends on a signed contract |
| Where we disagreed | Two confidence estimates for onboarding, and the value the team kept |
| Sensitivity check | Whether the top two are close enough that evidence should decide |
| Decision | Now, next and not now, with an owner and review date |
RICE scoring scales
| Input | Meaning | Typical scale |
|---|---|---|
| Reach | How many people or accounts it affects in the period | A count per quarter or month |
| Impact | How much it moves the goal for each of them | 3 massive, 2 high, 1 medium, 0.5 low, 0.25 minimal |
| Confidence | How much evidence supports reach and impact | 100% data, 80% some data, 50% a hunch |
| Effort | The total work to ship it | Person-months or person-weeks |
How to run a RICE prioritization session
- State the decision and period. "Which activation and reliability work do we do first next quarter?"
- Agree the units and scales. Before anyone scores, so numbers are comparable.
- Write candidates as problems with evidence. A feature name alone invites guesses.
- Estimate inputs where the knowledge is. Product estimates reach, engineering estimates effort, support and research inform impact. Each person can ask their own AI to pull the data and name the source.
- Compute and sanity-check. Would one confidence step change the top pick? If so, gather evidence first.
- Flag overrides. Contracts, compliance and dependencies can trump the score. Record them explicitly.
- Record now, next and not now. With an owner and a review date.
RICE prioritization tips
- Don't average disagreements away. Record both estimates and the evidence each side brought.
- Treat low confidence as a to-do. A 50% item often deserves an experiment, not a build.
- Keep effort honest. Include design, testing and rollout, not only coding.
- Use the score to start the conversation. It should not end it.
For the full cross-functional process, read our guide to feature prioritization. When several weighted criteria matter more than reach, use a decision matrix instead.
COMMON QUESTIONS
Frequently asked questions
What is RICE prioritization?
RICE is a prioritization framework that scores each idea as Reach × Impact × Confidence ÷ Effort. It was popularized by Intercom to help product teams compare features with different kinds of benefit on one scale.
How do you calculate a RICE score?
Multiply reach (people or accounts affected per period) by impact (for example 3 massive, 2 high, 1 medium, 0.5 low, 0.25 minimal) and by confidence (100%, 80% or 50%), then divide by effort (for example person-months).
What confidence levels should we use?
A common scale is 100% when you have data, 80% when you have some data, and 50% when it is mostly a hunch. Anything below 50% usually means the idea needs research before it is scored.
When should you not use RICE?
When strategic commitments, legal requirements, dependencies or severe downside risk dominate. Flag those constraints explicitly; the example on this page overrides one high-confidence feature because it depends on a signed contract.
What is the difference between RICE and ICE?
ICE scores Impact, Confidence and Ease, without reach. RICE adds reach, which makes it better for comparing work that affects very different numbers of users.
How do you stop RICE scores being gamed?
Agree the units and scales before scoring, have the person closest to each input estimate it with a named source, and record disagreements. Check whether one confidence step changes the top pick before trusting the order.
RUN IT WITH YOUR TEAM
Start your RICE prioritization in one click.
Everyone brings their own AI, adds their thinking, and you agree the result together on one live canvas.
More free templates
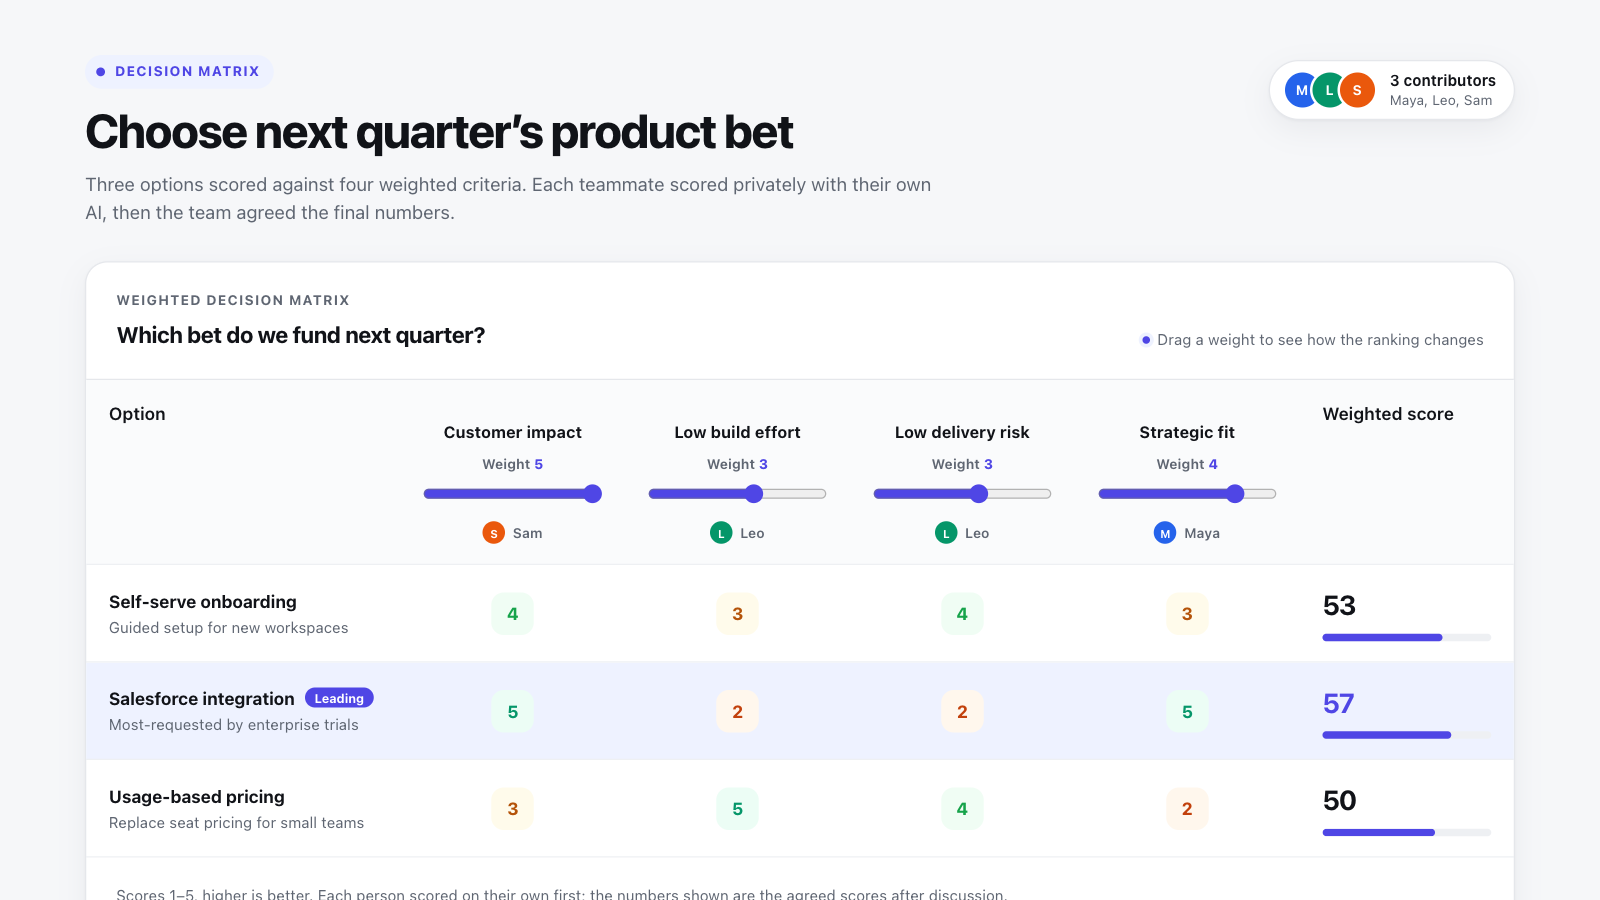
Decision matrix template
Score options against weighted criteria and see live which one wins, and how close it is.
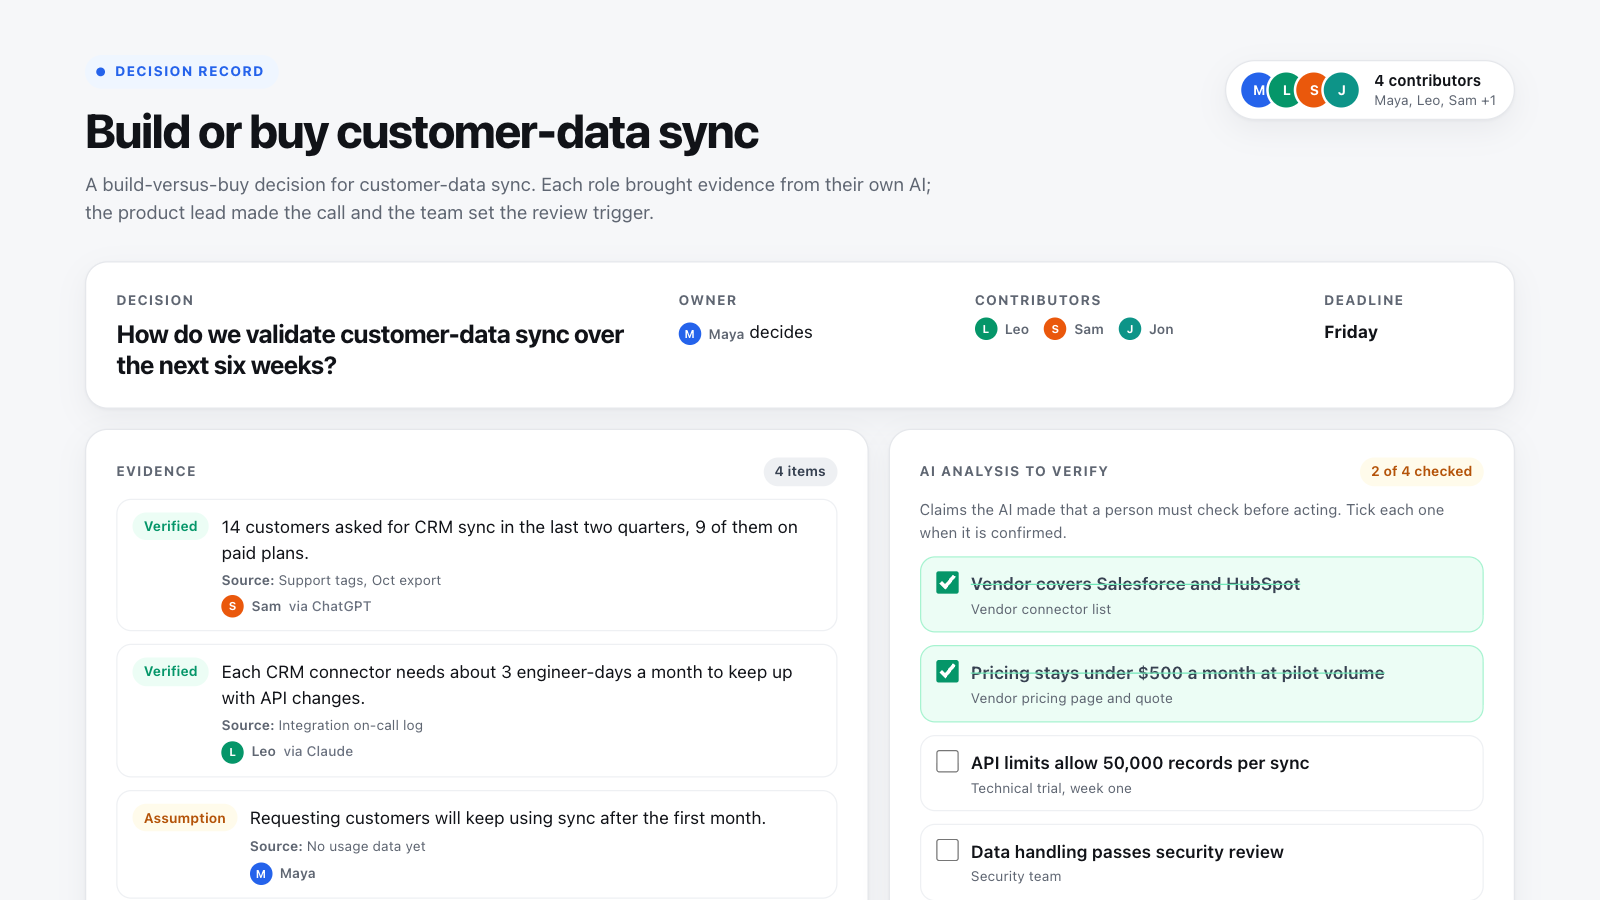
Decision record template
Record an AI-assisted decision: evidence, options, AI claims checked by a person, the call and its review trigger.
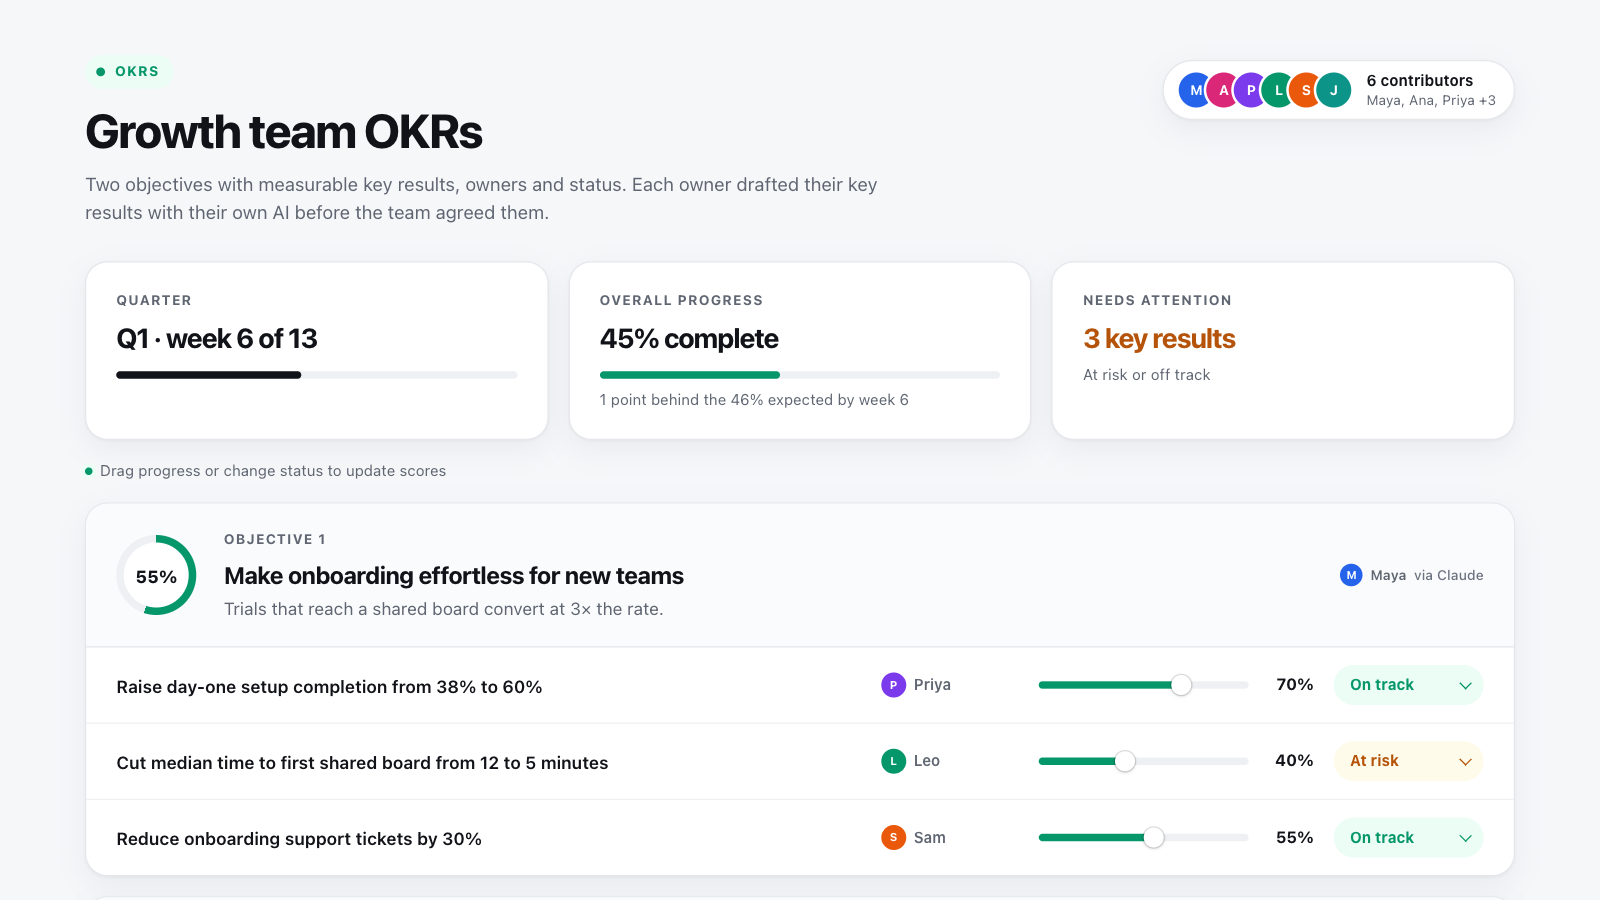
OKR template
Set objectives with measurable key results, owners and status, and track progress as a team.